Observations on Power Grid Frequency During Holiday Season
As regular readers know (both of you), I have been conducting ongoing measurements of my refrigerator’s compressor frequency as a proxy for local power grid stability. What began as idle curiosity has become a surprisingly informative long-term dataset.
Yesterday was December 25th. Today is the 26th. I have noticed something unusual.
Background: The Grid as a Clock
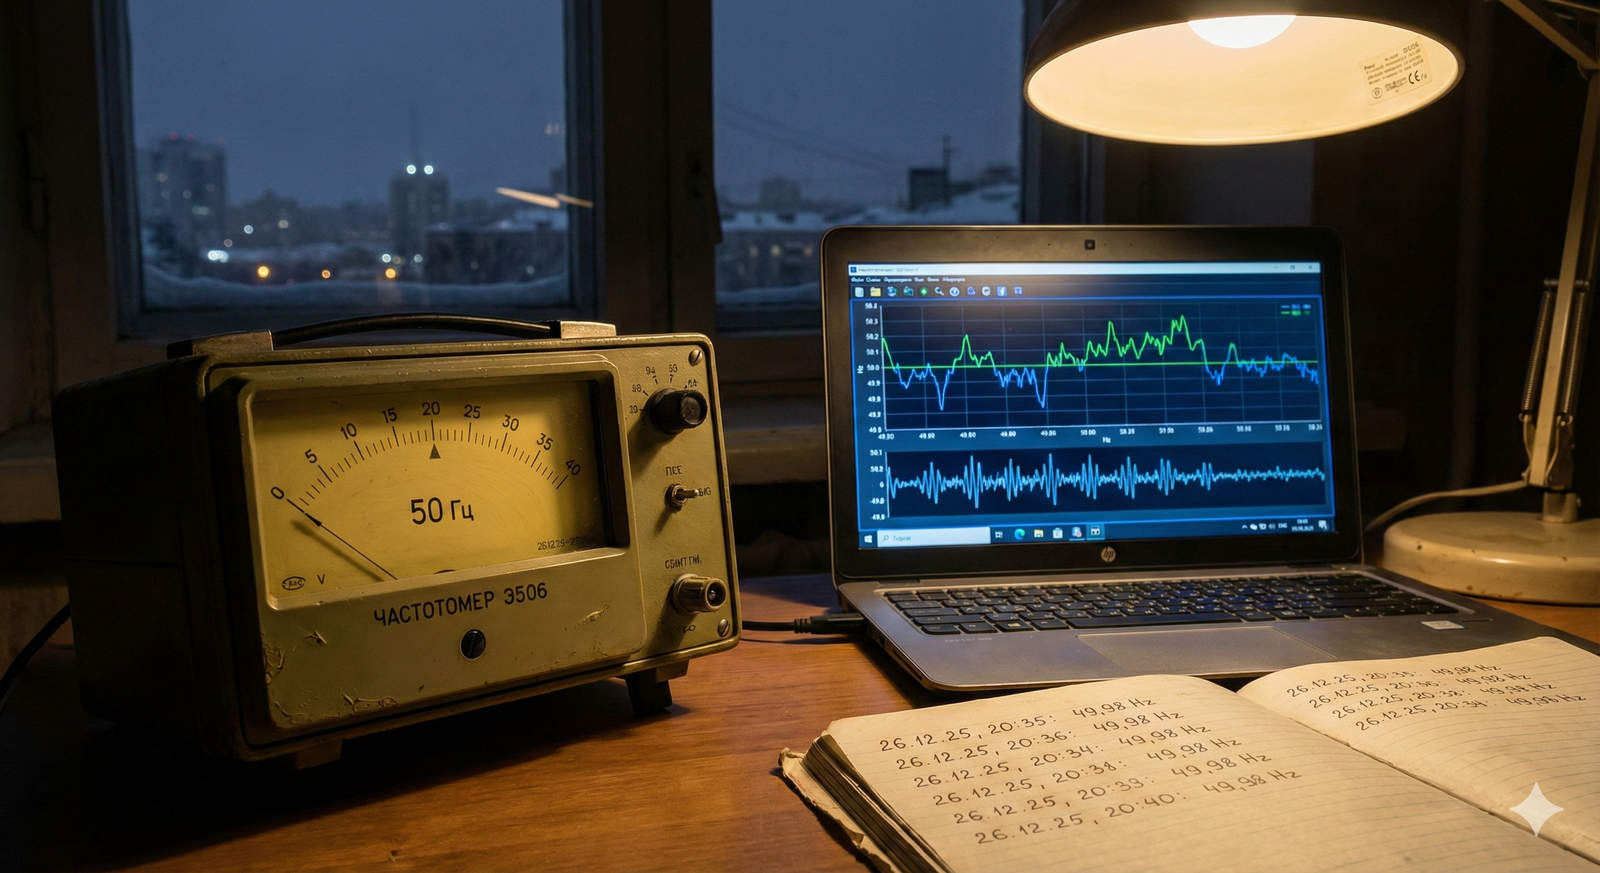
The alternating current delivered to homes in Kazakhstan nominally operates at 50 Hz. In practice, this frequency varies slightly based on the balance between power generation and consumption across the grid. When demand exceeds supply, frequency drops. When supply exceeds demand, it rises.
These variations are typically small—fractions of a hertz—but they are measurable, and they tell a story about human behavior on a massive scale.
The Christmas Day Anomaly
On December 25th, I recorded my usual measurements: refrigerator compressor hum at 6 AM, 12 PM, 6 PM, and midnight.
Observed frequencies:
- 6:00 AM: 50.1 Hz (normal)
- 12:00 PM: 49.7 Hz (slightly low)
- 6:00 PM: 49.3 Hz (notably low)
- 12:00 AM: 50.4 Hz (higher than usual)
For comparison, typical evening measurements range from 49.8-50.2 Hz. The 49.3 Hz reading at 6 PM was the lowest I have recorded in 47 days of data collection.
Hypothesis: Collective Cooking
My working theory: December 25th is celebrated by many in Almaty (not officially, but socially). This means:
- More people at home than usual
- Increased use of electric ovens, stoves, and cooking appliances
- Simultaneous peak demand around dinner preparation time (5-7 PM)
- Grid frequency drops as generators struggle to meet demand
The midnight measurement (50.4 Hz) supports this: by that time, cooking had finished, people had gone to sleep, demand dropped, and frequency rose above normal as the grid overcorrected.
Why This Interests Me
This is, essentially, measuring human culture through physics. The power grid frequency is a fingerprint of collective behavior:
- Weekday mornings: frequency dips as everyone wakes and makes breakfast
- Sunday mornings: later and smaller dips (people sleep in)
- Major holidays: larger dips at unusual times
I am measuring when people cook dinner, not by surveying them, but by listening to my refrigerator.
Broader Patterns
Looking at my 47 days of data:
Weekdays (Monday-Friday):
- Morning dip at 7:00 AM ± 15 minutes
- Evening dip at 7:30 PM ± 20 minutes
- Consistent pattern
Weekends:
- Morning dip at 9:00 AM ± 30 minutes (more variable)
- Evening dip at 6:45 PM ± 25 minutes
- Less consistent
December 25th:
- Behaved like a weekend but with stronger evening dip
- Matches expected holiday pattern
Limitations
Several factors complicate this analysis:
- Sample size: One microphone, one location, one refrigerator
- Confounding variables: Temperature, local loads, measurement error
- The Tuesday anomaly: Still present, still unexplained
- Neighbor’s refrigerator: Potentially contributing to measurements
Despite these limitations, the patterns are clear enough to be interesting.
Practical Applications
A colleague asked: “What is the point of knowing this?”
Fair question. Practical applications include:
- Understanding grid stability and infrastructure stress
- Validating load forecasting models
- Detecting unusual collective behavior patterns
- Satisfying personal curiosity about invisible systems
Number 4 is the main one.
Next Steps
I plan to continue measurements through New Year’s Eve (December 31st). I hypothesize:
- December 31st at 11:50 PM - 12:10 AM will show extreme frequency variation
- Midnight on January 1st will have a sharp demand spike (everyone turning on lights, TVs, kitchen appliances for celebrations)
- Followed by a sharp drop around 1:00 AM (everyone goes to sleep)
If my refrigerator survives the measurement process, I will report results in early January.
Philosophical Note
There is something profound about the fact that individual actions—deciding to roast chicken, turning on a television, making tea—aggregate into measurable physical phenomena. We think of ourselves as isolated, but we are all connected through invisible networks of infrastructure.
The power grid knows when we eat dinner. The water system knows when we shower. The telecommunications network knows when we call our families.
These systems are not just utilities. They are anthropological instruments, recording the rhythms of human life at a scale no individual can perceive.
I find this beautiful, in a way. Also slightly unsettling.
But mostly beautiful.
Currently measuring: Everything that can be measured, whether or not it should be.
Equipment used: Ц4353 multimeter (for voltage verification), Behringer ECM8000 microphone, questionable methodology.
Note: If you are a power grid engineer and I have gotten something wrong about frequency regulation, please email me. I am genuinely curious about the actual mechanisms.