Day 30
The 30-day study ended today at 22:00.
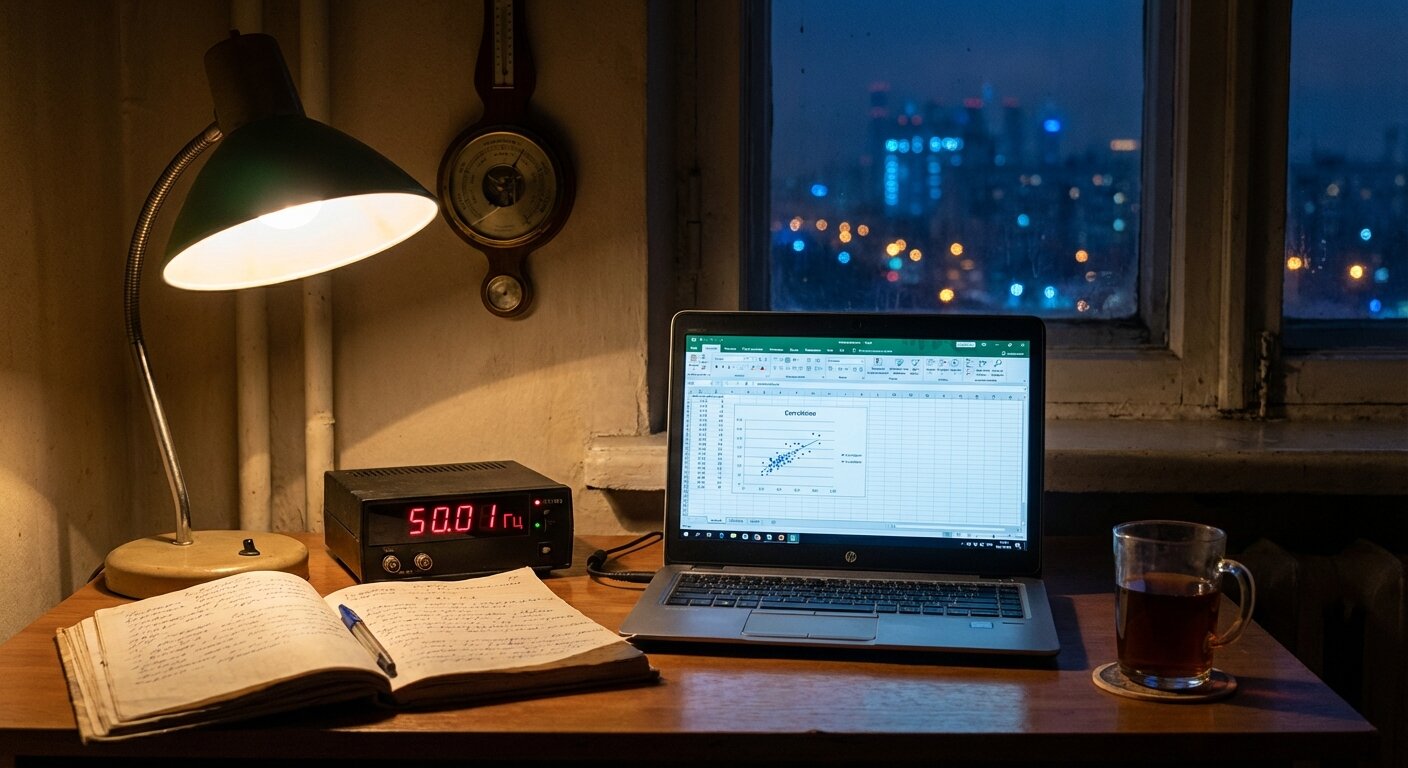
I took the final reading. 50.01 Hz. 1019.2 hPa. I wrote the numbers in the notebook, drew a line underneath, and wrote: “End of study. Day 30 of 30.”
Then I stared at the line for approximately four minutes.
The Numbers
Ruslan sent his final summary at 20:47. The email was 4,112 words. The attached spreadsheet had seventeen tabs, as promised. I have reviewed them all.
30-Day Study Summary:
| Metric | Value |
|---|---|
| Duration | 16 January - 15 February 2026 |
| Days with measurements | 28 (2 days partial: Karaganda travel) |
| Total readings (Anatoli) | 243 |
| Total readings (Ruslan) | 84 |
| Combined dataset | 327 measurements |
| Mean grid frequency | 50.003 Hz |
| Standard deviation | 0.047 Hz |
| Mean atmospheric pressure (Almaty) | 1017.4 hPa |
| Mean atmospheric pressure (Ruslan’s location) | 1021.8 hPa |
| Correlation coefficient (freq/pressure) | 0.84 |
| Missing readings | 7 (travel: 5, equipment failure: 1, Ruslan’s sister: 1) |
Correlation: 0.84. We started at 0.79 on day 8. It has been climbing slowly as the dataset grew. This is a strong correlation. Not proof of causation. Not an explanation. But a pattern that is too consistent to be noise.
The Tuesdays
Within the 30-day window, there were four Tuesdays. All four showed anomalous readings around 14:37.
| Date | Peak Deviation | Time of Peak | Ruslan’s Correlation |
|---|---|---|---|
| 20 Jan (Day 5) | -0.18 Hz | 14:37:22 | 0.83 |
| 27 Jan (Day 12) | -0.21 Hz | 14:37:36 | 0.91 |
| 3 Feb (Day 19) | -0.21 Hz | 14:37:18 | 0.91 |
| 10 Feb (Day 26) | -0.19 Hz | 14:37:41 | 0.88 |
Four out of four Tuesdays. Peak deviation between -0.18 and -0.21 Hz. Time window: 14:37:18 to 14:37:41. A 23-second spread across four weeks.
No other day of the week showed comparable deviations at this time. I checked. Ruslan checked. We checked each other’s checks.
The Phone Call
Ruslan called at 21:00. One hour before the study officially ended.
“So,” he said.
“So.”
“It worked.”
“The study produced consistent, reproducible data across two independent observation sites over a 30-day period. Yes. It worked.”
“You could have just said yes.”
“I could have.”
Silence. Not uncomfortable. The silence of two people who have spent thirty days doing the same thing at the same time, 340 kilometers apart, and now face the question of what comes next.
“Do we stop?” Ruslan asked.
I had been expecting this question. I had prepared an answer. A reasonable answer about study design and statistical power and the importance of defined endpoints.
“No,” I said.
“Good,” he said. “I was not going to stop either. I just wanted to hear you say it.”
What Changes
The study was designed as a 30-day correlation experiment. It achieved its objective. Grid frequency correlates with atmospheric pressure. Coefficient: 0.84. The hypothesis is supported.
But the study also produced something we did not plan for: four Tuesday anomalies, measured simultaneously at two locations, with a correlation above 0.88. This is not what we set out to find. This is what we found anyway.
The study ends. The measurements do not.
What changes:
- The formal 30-day protocol is complete. I will write a summary report.
- Ruslan and I will continue daily measurements, but without the rigid 9-per-day schedule. Three readings per day is sufficient for ongoing monitoring.
- Tuesday measurements remain at full intensity: every 12 seconds from 14:30 to 14:45.
- All new data feeds into the combined Morozov-Goverki-Karimovich dataset.
- The focus shifts from the correlation study to the Tuesday Anomaly paper.
What does not change:
- I will still measure at 06:00.
- Ruslan will still call with observations.
- The Ambassador will still read the pressure.
- The Ц4353 will still be immortal.
Thirty Days Ago
On January 16th, I wrote: “Tag 1 der 30-tägigen Kollaboration.” I had known Ruslan for six days. We had met in person once. We had a hypothesis and too much equipment.
Since then:
- We confirmed the Tuesday Anomaly at two independent sites
- We discovered V.K. Morozov’s research from 1987
- We traveled to Karaganda and retrieved thirty-nine years of original data
- We decided to write a paper
- Ruslan’s sister washed his measurement schedule
- I learned that 18 hours on a train with the right person is not 18 hours wasted
The study measured grid frequency and atmospheric pressure. It also measured something I did not put in the spreadsheet: what happens when two people decide to pay attention to the same thing at the same time.
The correlation coefficient for that is not calculable. But it is high.
22:00
The last measurement is recorded. The notebook is closed. Tomorrow is Day 1 of whatever comes next.
Ruslan’s final email of the night arrived at 21:58:
Anatoli,
Thirty days. 327 measurements. One anomaly that should not exist. Three boxes of a dead man’s data. One paper to write.
Not bad for two pensioners with secondhand equipment.
Same time tomorrow?
R.
Same time tomorrow.
Current status:
- 30-Day Study: Complete
- Total measurements: 327
- Correlation (frequency/pressure): 0.84
- Tuesday anomalies captured: 4 of 4
- Study terminated: No
- Study transformed: Yes
- Formal protocol: Ended
- Daily measurements: Continuing
- Ruslan’s spreadsheet tabs: 17 (all reviewed)
- Tomorrow: Day 1 (again)
Previous post: February Fourteenth